Ethereum Price Analysis: Is $2K Next as Coinbase Premium Hits Yearly Low?
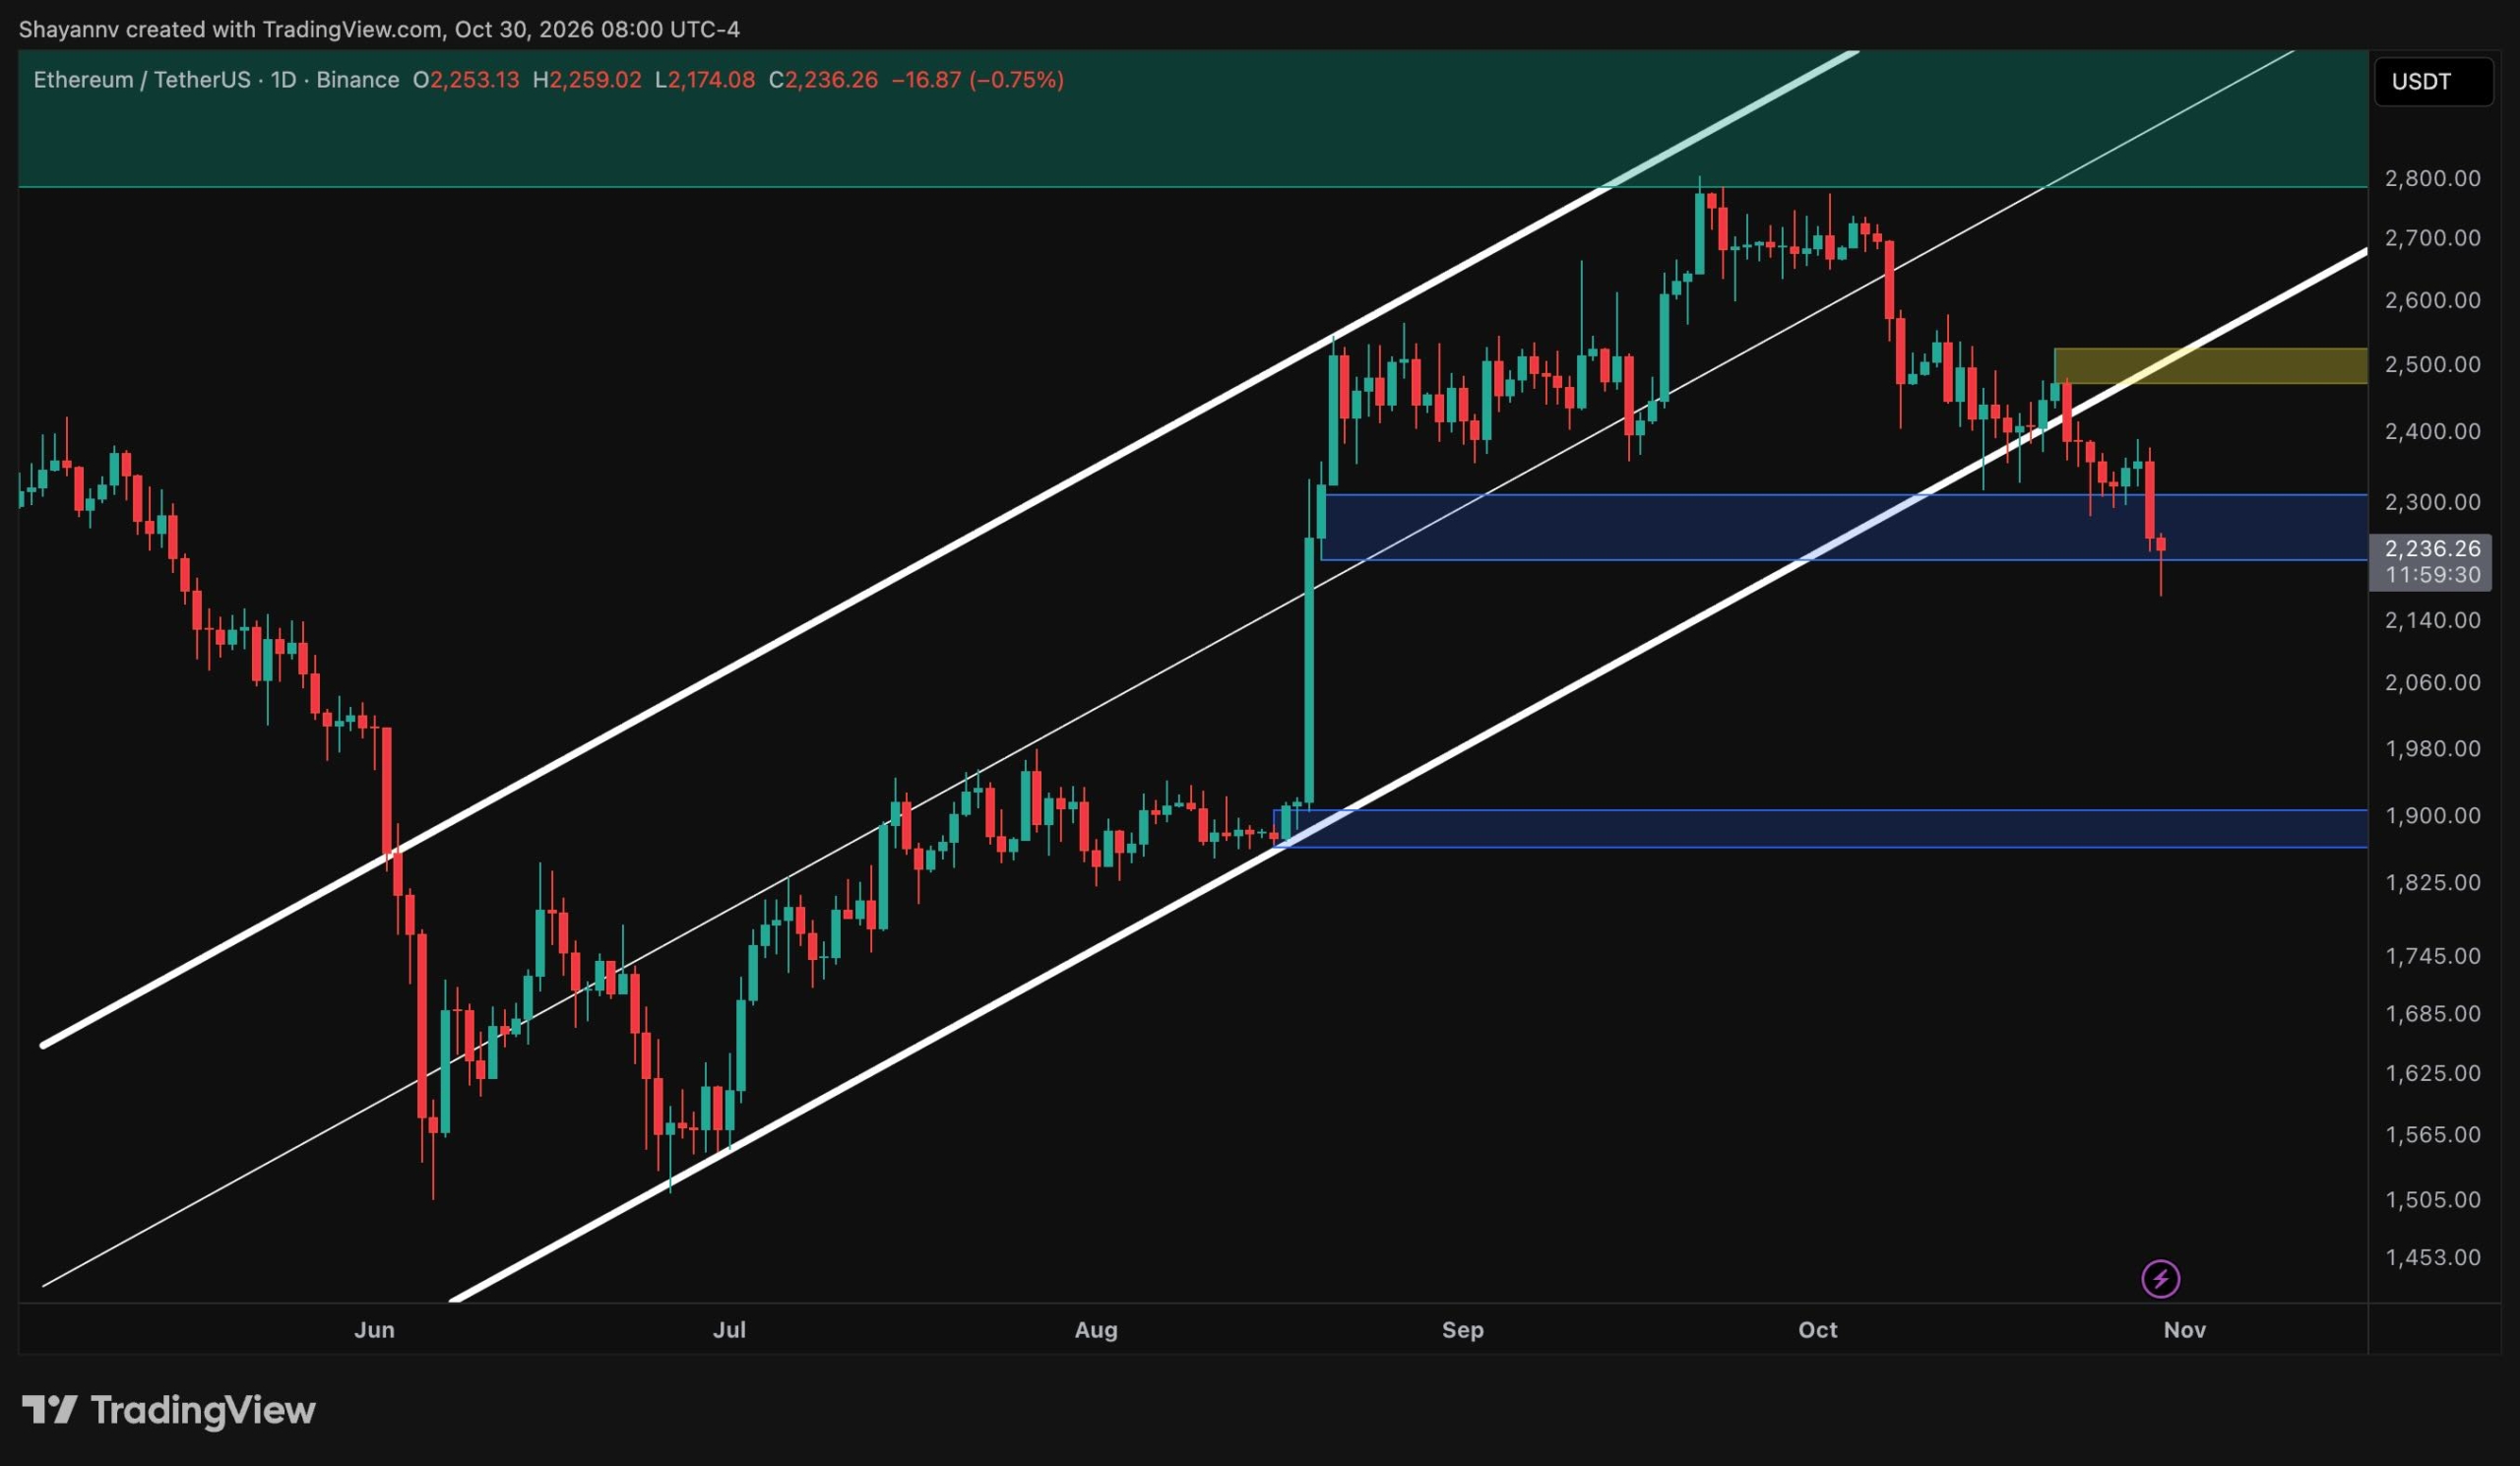
Ethereum has slipped toward $2.2K after another wave of selling extended the decline from the $2.8K highs. With ETH now trading inside a key demand zone that also aligns with the lower boundary of its short-term descending channel, the current area could decide whether the correction stabilizes or deepens toward lower support. Meanwhile, the Coinbase Premium Index has dropped to its lowest reading in over a year, pointing to notably weak demand from US investors.
Ethereum Price Analysis: The Daily Chart
Ethereum’s daily chart shows that the ascending channel that carried the price higher from the June lows near $1.5K has been broken. After rejection from the $2.8K supply zone in September, ETH fell below the channel’s lower boundary and then retested it around $2.5K, where sellers rejected the price again. This failed retest suggests the former support has turned into resistance.
The decline has now brought the asset into the $2.2K–$2.3K demand zone, which is located below the consolidation after August’s sharp rally. Today’s candle briefly wicked toward $2.15K before recovering, indicating that buyers are responding. However, the rebound remains modest, and the zone has yet to produce a convincing reaction.
If this support holds, ETH could attempt a recovery toward $2.5K. On the contrary, a valid daily close below $2.2K would expose the $1.9K order block, which is the base of the August rally and the next major demand area visible on the chart.
ETH/USDT 4-Hour Chart
The 4-hour chart shows Ethereum trading within a descending channel since early October, characterized by consistent lower highs and lower lows. The upper boundary has acted as dynamic resistance, most notably on October 21, when the price was rejected decisively from the $2.5K zone. After several days of ranging between approximately $2.3K and $2.4K, ETH broke lower aggressively.
The sell-off briefly pushed the price to the channel’s lower boundary near $2.15K, where buyers stepped in. ETH is now consolidating around $2.24K, inside the horizontal demand zone. This confluence of channel support and horizontal demand makes the current region particularly important for the short-term outlook.
A successful defense could produce a relief bounce toward the $2.4K range highs and the channel’s upper boundary near $2.42K, and a potential breakout above it would weaken the bearish structure. On the other hand, a confirmed move beneath the lower trendline would signal that sellers have regained control, leaving the $1.9K region as the next likely target.

Sentiment Analysis
The Coinbase Premium Index on CryptoQuant measures the price gap between ETH on Coinbase, a venue widely used by US investors, and Binance. Positive readings indicate stronger buying from US participants, while negative values suggest weaker demand or heavier selling on Coinbase relative to the broader market.
Throughout mid-2025, the index remained largely positive as ETH rallied toward $4.7K. Since November 2025, readings have mostly stayed negative, coinciding with the asset’s prolonged downtrend. The metric briefly turned positive in September 2026 around the $2.5K-$2.6K consolidation, but it has since collapsed to approximately -0.21, which is arguably the deepest reading in the visible period, alongside the latest drop toward $2.2K.
This suggests US demand has weakened sharply. Notably, a similarly extreme reading in February 2026 occurred close to a local low, so the current figure could also reflect capitulation rather than sustained selling. Either way, the index would need to recover alongside price for ETH to defend the $2.2K support and challenge the $2.5K resistance. Otherwise, the excess supply and weak technicals could bring ETH back below $2K soon.

The post Ethereum Price Analysis: Is $2K Next as Coinbase Premium Hits Yearly Low? appeared first on CryptoPotato.