Bitcoin Price Analysis: Is the September Rally Structure in Danger as BTC Hangs by a Thread?
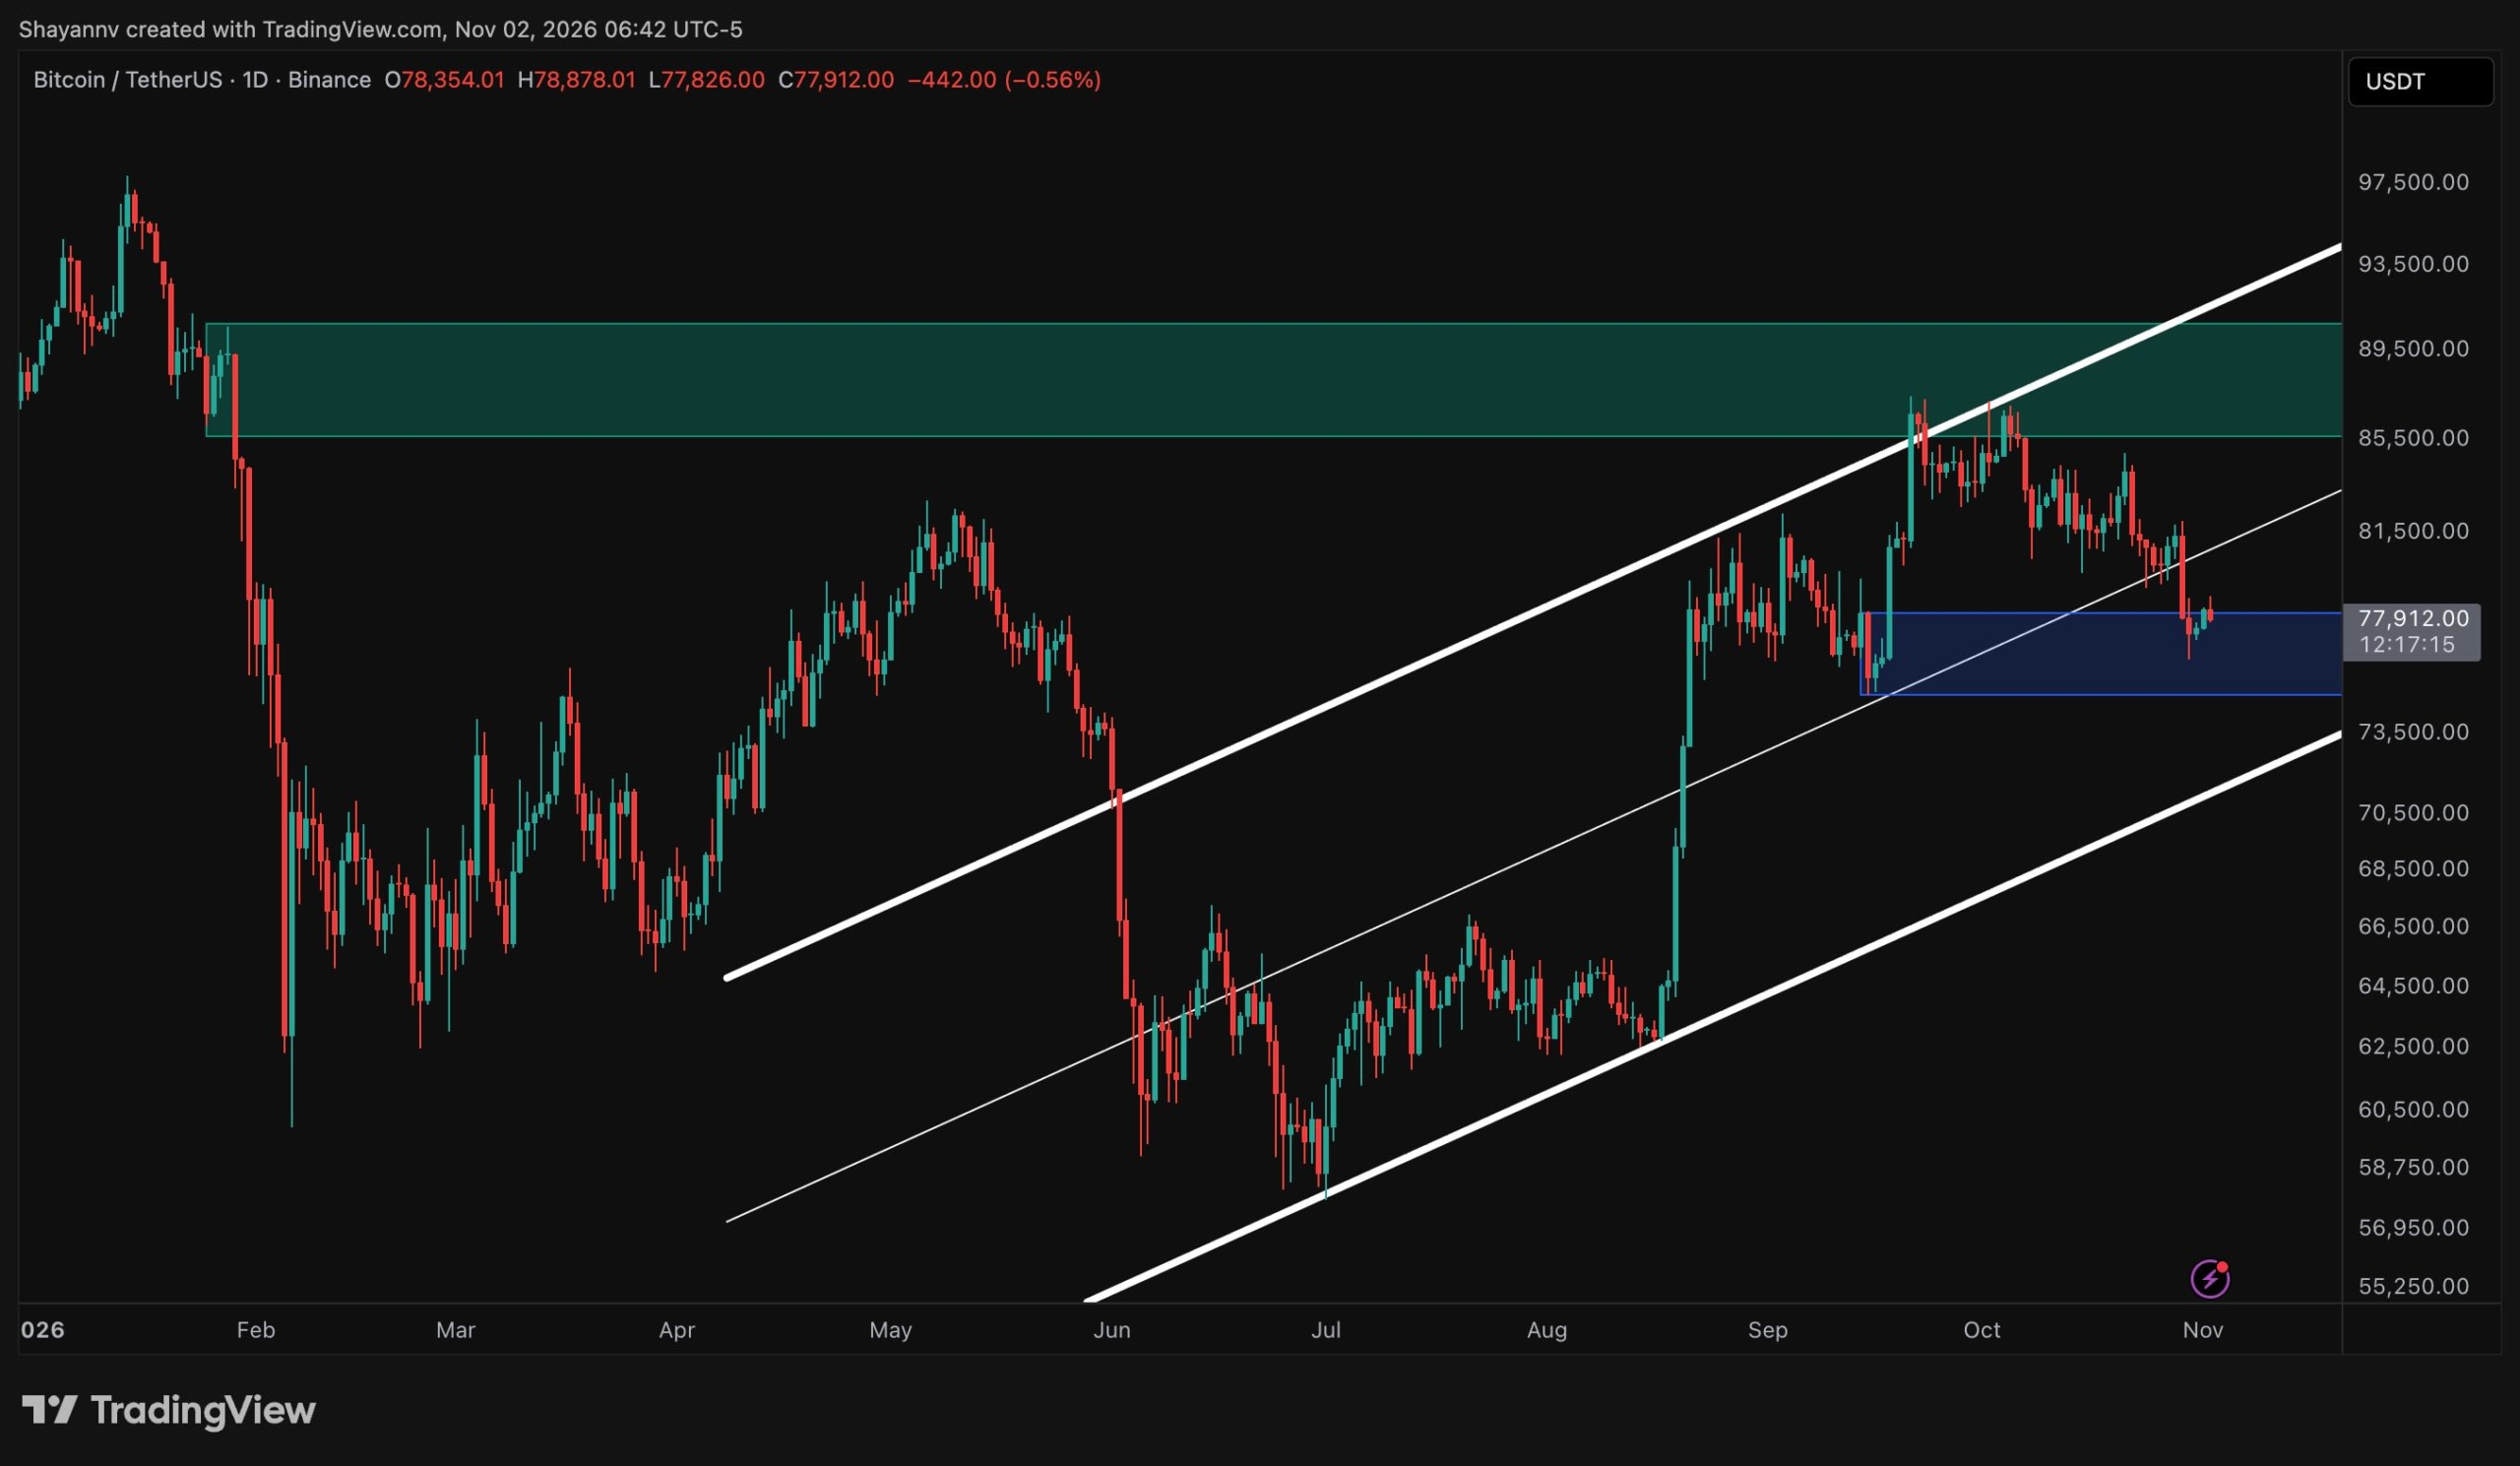
Bitcoin is attempting to stabilize around $78K after posting its fourth straight weekly loss, with sentiment weighed down by the record Binance hack and a $643.3 million withdrawal from U.S. spot Bitcoin ETFs on Friday. The asset now sits inside a key demand zone that could decide whether the September rally structure survives.
Meanwhile, the Velocity metric has climbed to its highest level since late 2024, suggesting that supply is circulating more actively even as prices decline.
Bitcoin Price Analysis: The Daily Chart
On the daily timeframe, Bitcoin continues to trade within the broad ascending channel that has guided the recovery from the summer lows near $58K. However, the rejection from the upper boundary and the $86K–$90K supply zone in late September has given way to a series of lower highs, and last week’s sell-off pushed BTC below the channel’s midline around $82K.
The price is now trading inside the $75K–$78K order block, which formed the base of the sharp September rally. The lower wick printed during the hack-driven drop shows buyers responding here, but the rebound has so far been shallow. Holding this zone would allow BTC to attempt a return toward the channel midline and, eventually, the $86K–$90K supply zone.
Conversely, a daily candle closing below $75K would expose the channel’s lower boundary near $73K. A breakdown through that confluence would invalidate the structure that has carried the price higher since mid-year and raise the risk of a deeper correction. For now, the channel remains intact, but sellers clearly control short-term momentum.
BTC/USDT 4-Hour Chart
The 4-hour chart offers a clearer view of the deterioration. Bitcoin broke below the lower boundary of its orange ascending channel around October 23, and the subsequent rebound stalled inside the $80K-$82K supply zone, effectively retesting the broken trendline from below. That rejection was followed by a sharp sell-off as news of the Binance breach hit the market.
Buyers stepped in at the $76K demand zone, which sits within the daily order block, and the price has since recovered toward $79K before easing back to around $78K. A sustained move above $79K could bring the $80K-$82K supply zone back into play, while reclaiming it would open the way toward $85K, where the last significant rebound was rejected.
On the downside, losing $76K would likely trigger a test of the lower edge of demand near $75K, the last support before the daily channel’s lower boundary. Until BTC reclaims the broken channel, the short-term structure favors sellers, with rebounds likely to meet overhead supply.

On-Chain Analysis
Velocity on CryptoQuant measures how quickly coins circulate through the network relative to the total supply, applying the economic concept of money velocity to on-chain activity. Rising readings indicate that coins are changing hands more frequently, while declining readings point to long-term holding behavior and supply moving into dormant addresses.
The metric fell steadily from roughly 15.8 in early 2024 to around 12.1 in October 2025, a period in which Bitcoin rallied to its all-time high near $125K. That combination reflected classic scarcity dynamics, with a growing share of supply held off the market. Since then, the trend has reversed, with velocity rising to approximately 14.6 even as the price dropped sharply.
This divergence suggests that previously idle coins are re-entering circulation, a pattern more consistent with redistribution than accumulation, and one that weakens the supply-squeeze dynamic behind the 2025 rally. However, velocity alone cannot reveal who is buying or selling. If it keeps climbing while BTC struggles below $82K, the $75K order block would likely face increasing pressure, which could reverse the whole BTC price rebound since summer.

The post Bitcoin Price Analysis: Is the September Rally Structure in Danger as BTC Hangs by a Thread? appeared first on CryptoPotato.